How Car Dealers Can Better Understand Bounce Rate And Engagement In Google Analytics 4

If you've spent any amount of time using Google Universal Analytics (UA) you already know what a "bounce rate" is and why it is critically important to understanding the health of your website and customer experience. The intent of the bounce rate is to measure how engaging your dealership's website is, in-a-nutshell it is the percentage of sessions that were not "engaged" with your content.
I want to mention up-front that having a low bounce rate is nice, but it is also one of the most abused metrics in the automotive industry. There are plenty of providers out there who will send an extra GA Event every time someone scrolls, stays on the page more than 30 seconds, etc. So when you hear about extraordinarily low bounce rates on a website providers platform, you'll want to make sure it's not just because they are gaming the event tags to produce an artificially lowered metric.
Understanding WHY your customers leave your site without doing anything of significance is a full time job for marketers as it is. Was it the design? The content? The CTA's? Was it a mistaken click-through? These are the things we ask ourselves day in and day out to determine the reason our prospects are landing and leaving before they've had a chance to do anything that could lead to them buying a vehicle. Was it them, or was it us?
It seems curious then why Google Analytics 4 (GA4) chose (at first anyways) to discontinue the classic "bounce rate" metric we've all come to rely on over the years to determine our user's intent. We had it, then lost it, and now GA4 has recently brought it back (sort of, it's not front and center anymore, but you can still add it to custom exploration reports as a column metric). We wanted to talk about what's changed, why, and how you and your marketing team can better understand and utilize "bounce rate" and the (more important) "engagement rate".
In our view, "Bounce Rate" has essentially taken a back seat to "Engagement rate". When we say "engagement", most of you will think of things like clicks, scrolls, VDP image views, page navigation, video plays, etc. However, GA4 defines user engagement as the amount of time that your user has your page OPEN, and in the foreground. In other words, how long they have your website on-screen. When your user closes the tab, or switches to another tab/application- GA4 sends the event, defines it as user_engagement, and defines the duration of the event.
There are only a select few scenarios that will trigger the user_engagement event, so it's important to remember that "Engaged" status can only be applied to users who:
- Visited 2 or more pages (and registered pageview events)
- Spent MORE than 10 seconds on a particular page
- Converted
Without meeting any of these criteria, everybody else would be considered non-engaged, or (to use our favorite nomenclature) a "bounce". Therefore, the bounce rate is the inverse of engagement rate. An 85% engagement rate would be the same as a 15% bounce rate.
The engagement metrics that GA4 currently allows you to track are:
- Engagement rate
- Engagement sessions
- Engaged sessions per user
- Average engagement time
As we noted earlier, by default, GA4 considers any user who spends 10+ seconds on your website as "engaged". For most car dealers, tracking ONLY this 10 second figure will do nothing more than muddy the waters and render the engagement rate an arbitrary statistic. 10 seconds? The only example we could think of for car dealers (that wouldn't set off another engagement trigger) would be if a customer comes to your website to quickly print service and parts coupons and then leaves.
Luckily, GA4 does provide for a way to configure and track custom engagement thresholds. Believe it or not, 30 seconds spent on your site paints a very different picture of the user than 11 seconds spent on site. Likewise, some dealers might want to set the rate even higher to 50 or 60 seconds so that an "engaged" user would be defined as somebody who really showed some intent to shop. We would recommend leaving it set at the standard 10 second threshold and then setup custom events using Google Tag Manager to track the 30 and 60 second intervals (which we think are generally much more valuable).

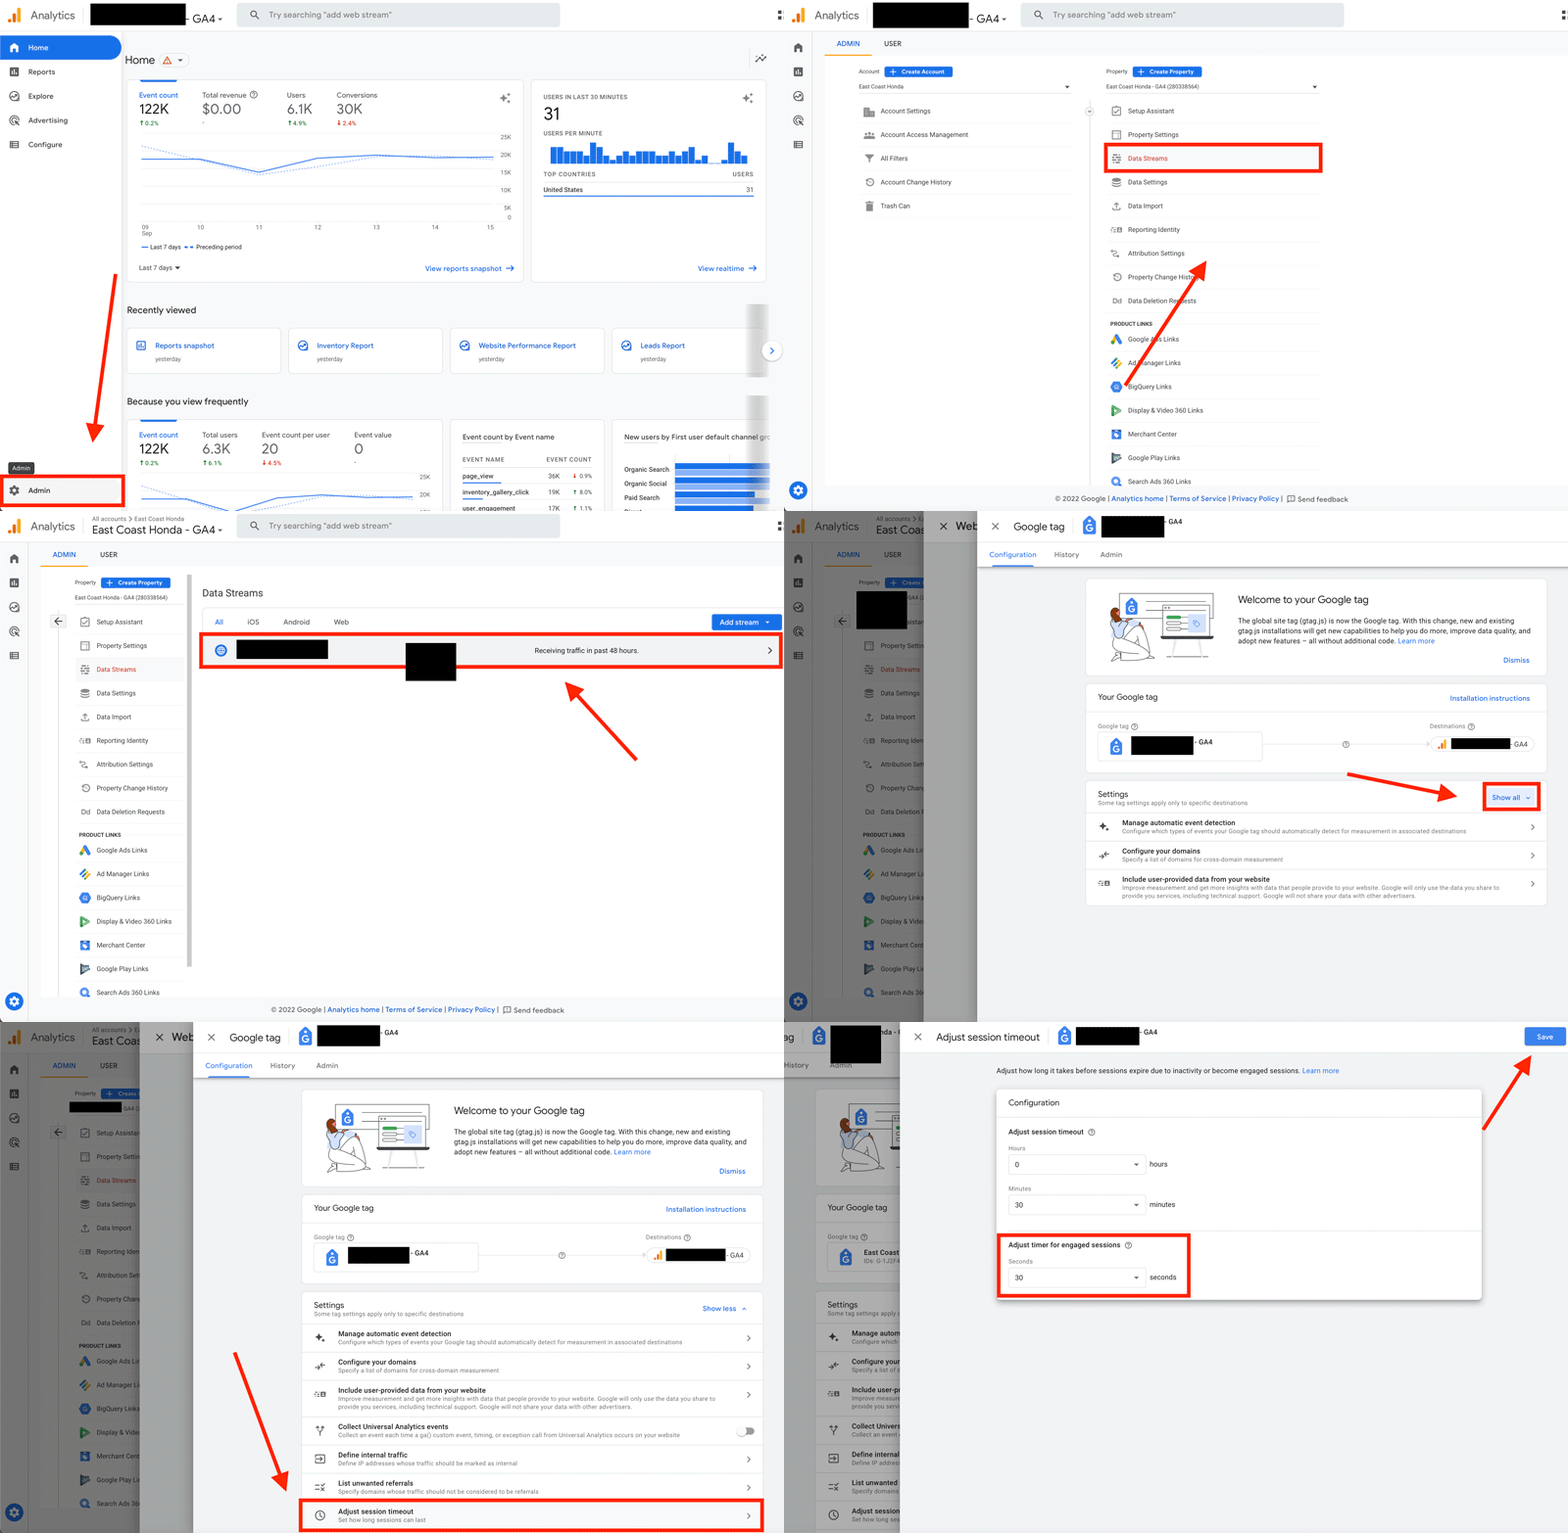
If you want to change this setting anyways, you can easily set a custom engagement rate for your site by adjusting the session timeout in your GA4 Admin portal. Just Click on Admin > then Data Streams > Click on Your Website property > Scroll Down to click Configure Tag Settings> then click Show All to expand the hidden settings > scroll down and click Adjust Session Timeout. > From there, all you need to do is adjust the timer for engaged sessions and click Save.
If you'd like some help learning how to customize your reports to include custom metrics be sure to take a closer look at our article on setting up custom reports in GA4 and while you're at it check out some of our other automotive GA4 resources like how to use the Explorations tool to build custom reports so you can add things like "Bounce Rate" etc. If this is all going over your head a bit, and you're brand new to GA4- be sure to check out our GA4 Getting Started guide. As always, reach out to sales@autofusion.com or click here if you'd like to schedule an SEO or Website consultation with our sales team.